How to Choose White LED Plant Lights? Learn How to Select the Right Spectrum for Your Crops
"Full spectrum white LED" fixtures with the same wattage and 4000K colour temperature rating are available from two suppliers. One is 20% cheaper. Which do you pick?
This tutorial is for you if your response is only based on cost. The basic fact that white LEDs are not made equal has already been demonstrated by Benwei's research. Plant reactions to spectra that are identical to human vision might differ greatly. That issue has been resolved.
However, this discovery presents a new challenge for producers. What specifically should you look at when a vendor delivers you a spec sheet that is filled with charts and numbers? How can the performance of a fixture be independently confirmed?
These questions are addressed in this guide. It shows you how to assess white LED choices on
1. White LED Fundamentals: A Brief Recap of What "White" Means for Plants
We need a common baseline before we get into spec sheets. There are two important facts.
1.1 How Humans See White vs. How Plants "See" It
| Aspect | Human Eye | Plant |
|---|---|---|
| Mechanism | RGB cones mix colors to create white perception | Photoreceptors detect individual wavelengths and ratios |
| "White" Means | Balanced red, green, and blue appears white | Any spectrum with enough green appears white, regardless of other bands |
| Key Takeaway | Easily fooled by metamerism | Responds to spectral composition, not perceived color |
Because of this, two "white" LEDs with the same Kelvin rating can cause very distinct plant reactions. You see white in your eyes. Certain wavelengths, ratios, and missing pieces are perceived by your plants.
1.2 White Light's Three Crucial "Hidden" Factors
Three factors influence how your crop reacts beneath the white appearance:
Plant height and leaf growth are regulated by the R:FR Ratio (Red to Far-Red). Low R:FR causes plants to extend, while high R:FR maintains them compact. This is particularly important in buildings that are indoors and lack natural light.
Blue-to-Green Ratio: Controls secondary metabolite synthesis and morphogenesis. Green light can counteract the effects of blue light on certain molecules, while blue light inhibits stretch.
The accuracy with which you can visually evaluate the health of a plant is determined by the CRI (Colour Rendering Index). Early identification of chlorosis, necrosis, and nutrient shortages is made possible by high CRI.
The practical impact was validated by Valoya's Arabidopsis studies, which showed quantifiable variations in biomass, height, and blooming time under identical "white" light when these hidden variables were changed.
The next step is to learn how to locate these variables on an actual specification sheet.
2. Comprehending White LED Specifications: How to Interpret the Data and Diagrams
Vendors sometimes use numbers that seem impressive but don't provide much information. Here's how to break through the clutter.
2.1 Colour Temperature (CCT): What It Does and Doesn't Tell You
The way light appears to human eyes is described by CCT, which is measured in Kelvin. Warm white (2700–3500K) has a yellowish appearance. Cool white (5500–6500K) has a bluish appearance.
What you learn from CCT: A general indication of spectral inclination. There is typically more blue in cool white and more red in warm white.
The precise spectral makeup is something that CCT does not reveal. The R:FR ratios, blue-to-green balances, and photosynthetic photon effectiveness of two 4000K lights may differ.
An actual example: Compact, stocky plants are produced by a single 4000K fixture with a high R:FR ratio. Stretch is seen in another 4000K fixture with a low R:FR ratio. Different results with the same CCT.
Pro Tip: Never use CCT as a final criterion for making decisions; instead, use it as a rough filter.
2.2 The Significance of CRI (Colour Rendering Index) in Plant Inspection
On a scale of 0 to 100, CRI evaluates how well a light source reproduces colour in comparison to natural sunlight. Sunlight receives a score of 100.
CRI is not about aesthetics for growers. It performs three operational tasks:
Disease Detection: Precise colour rendering enables the early detection of disease spots, necrosis, and chlorosis before they spread.
Nutrient Diagnosis: Only under high-CRI light may subtle colour changes that indicate deficits in iron, magnesium, or nitrogen be seen.
Employee Productivity: When working in natural-looking light, employees report reduced eye strain and make fewer mistakes during inspections.
Aim for at least CRI > 80 in cultivation conditions. CRI > 90 is ideal for research, propagation, or any process where judgements are made based on visual inspection. In order to facilitate trustworthy crop scouting, Benwei's unique NS1 spectrum achieves CRI 90.
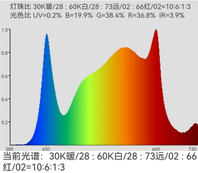
2.3 How to Interpret a Spectrum Graph Without a PhD
Wavelength (x-axis, in nanometers) is plotted against relative intensity (y-axis) in a spectrum graph. It is the most detailed document available from a vendor.
Any white LED spectrum chart should have the following five characteristics:
1. Blue Peak (400–500 nm)
Find the highest point in the blue area. More compact growth is typically correlated with a higher, sharper blue peak. A warmer, redder spectrum is suggested by a lower, wider blue area.
2. Green Content (500–600 nm)
How "white" the light seems depends on the green area. More green enhances canopy penetration and gives the appearance of being whiter to human sight. But during flowering, too much green can interfere with several secondary metabolite processes.
3. Red Peak: 600–700 nm in height and width
Examine the area that is red. Over a wide range, steady-state photosynthesis is driven by a broad red plateau. Although it may overlook other photosynthetic pigments, a narrow 660 nm spike effectively targets chlorophyll absorption. For a variety of crops, broad is frequently preferable.
4. The 700–750 nm Far-Red Tail
Verify if the curve goes beyond 700 nm. The R:FR ratio is lowered when a far-red tail is present, which may encourage stem elongation and leaf expansion. Plants remain more compact when there is little or no far-red. The fact that two "white" fittings result in differing plant heights is frequently explained by this one characteristic.
5. UV Exposure (less than 400 nm)
Check for any output that is smaller than 400 nm. To increase spectrum breadth, some white LEDs have near-UV chips. Ask the vendor for the precise UV-A or UV-B percentages if UV output is present, as these have an impact on the generation of secondary metabolites.
For a brief comparison exercise, consider two spectrum graphs that are both marked "cool white." Graph A displays a small red peak at 660 nm, a deep green valley, a strong blue spike, and no far-red tail. Graph B has a wide red plateau, a noticeable far-red tail, a moderate blue area, and a constant green content. Graph A will likely produce shorter, more compact plants. Taller plants with higher leaf expansion are probably what Graph B will yield. identical CCT label. distinct spectrum. distinct outcomes.
Graph A

Graph B

3. White LED Selection by Use: A Framework for Decision-Making
Here's how to adapt white LED qualities to particular growing settings once you've mastered reading.
3.1 Sunlight-Match for Research and Propagation
Consistency and comparability to outdoor field outcomes are essential for research experiments. Balanced spectra that reduce stress are advantageous for tissue culture and proliferation.
Recommendation: R:FR ratio around natural sunlight (~1.2–1.4), high-CRI (≥ 90). balanced production of red, green, and blue. frequently referred to as "daylight spectrum" or "sunlight match."
Why: Results that can be repeated throughout trials. phenotypes similar to those of references grown outdoors. Be gentle with fragile seedlings and explants.
3.2 High-Efficiency for Vertical Farming and Leafy Greens White, Warm to Neutral
Microgreens, basil, kale, and lettuce all emphasise quick biomass accumulation. Operating margins in stacked indoor systems are directly impacted by energy efficiency.
Warm white to neutral white (3000–5000K) with a somewhat high red proportion is advised. CRI is at least 80. Spectral emphasises photosynthetic efficiency over flawless colour depiction.
Why? Because red photons have the best quantum efficiency for driving photosynthesis. In general, warm white lighting produce more red than blue, which promotes biomass and leaf development. The controlled environment of vertical farms reduces the need for visual inspection, so CRI can be slightly relaxed in favor of PPE (photosynthetic photon efficacy).
3.3 Full Spectrum with Enhanced Red for Flowering and Fruiting Crops
For the development of their reproductive systems, tomatoes, peppers, cannabis, and decorative flowers require spectral support.
Full spectrum white LEDs with additional 660 nm red are advised. To preserve compact flower structure, the R:FR ratio must be greater than 2:1. CRI is at least 80. Spectrum between vegetative and blooming periods can be adjusted.
Why: Higher red ratios cause flower initiation and fruit set. Without over-engineering the whole white spectrum, the 660 nm addition directly targets the absorption of chlorophyll. The stretch that lowers final yield density is avoided by keeping the R:FR ratio high during early flowering.
3.4 Adjustable White for Dual-Purpose Spaces (People and Plants)
Plant health and human comfort must be balanced in office agriculture, retail displays, and living walls.
Warm white and cool white channels can be independently controlled with dual-channel or tuneable white LED bulbs. CRI ≥ 90 for both plant assessment and aesthetic appeal.
Why? Because employees can programme a plant-optimized spectrum during unoccupied times and switch to a comfortable neutral white during working hours. A high CRI guarantees that clients see colourful, not washed-out, plants.
Application Summary Table
| Application | Recommended CCT | Recommended CRI | Key Spectral Feature |
|---|---|---|---|
| Research & Propagation | 5000–6500K | ≥ 90 | Balanced daylight match, R:FR ~1.2–1.4 |
| Leafy Greens & Vertical Farms | 3000–5000K | ≥ 80 | High red proportion, high PPE |
| Flowering & Fruiting | 3000–4000K + 660nm | ≥ 80 | Enhanced red, R:FR > 2:1 |
| Dual-Purpose (Plants + People) | Tunable 2700–6500K | ≥ 90 | Independent warm/cool channel control |
4. How to Assess White LED Quality (Without Expensive Equipment)
Not every operation has a spectrometer. These are three useful assessment techniques.
4.1 The Easy Plant Exam
Choose a crop that responds well, like basil or lettuce. For two to three weeks, grow the same variety side by side under the new white LED lamp and your current benchmark light. Maintain the same photoperiod, PPFD, and watering under all other circumstances.
Compare the height of the plant, the colour of the leaves, and if straining is present or not. The R:FR ratio or blue content may be inadequate if the new fixture yields taller, paler plants. Blue content may be too high if plants have thicker leaves and are very compact.
More is revealed by a two-week side-by-side trial than by a specification sheet.
4.2 Verifying Vendor Information
Ask any possible provider for these four items:
Full spectrum graph displaying output between 380 and 800 nm
PPE rating is expressed in µmol/J rather than lumens per watt.
Internal measurements, not third-party test reports from a recognised laboratory
The fixture's LED chip model and brand
Be cautious when dealing with a dealer that refuses or is unable to supply these.
4.3 Warning Signs When Assessing White LEDs
Keep an eye out for these warning indicators:
CRI below 70 without a reason
Refusal or incapacity to supply a spectrum graph
Avoiding enquiries on the R:FR ratio
Spec sheets with "too perfect" or manually smoothed spectrum curves
"Full spectrum" claims that don't specify the wavelength range
5. White LED's Future: Dynamic Spectrum and Beyond
White LED systems of the future generation go beyond predefined spectra. Growers can match spectrum to developmental stage by adjusting CCT, R:FR ratio, and blue-to-green balance throughout the crop cycle with dynamic spectrum control.
Early applications connect crop growth models and environmental sensors to spectrum shifts. During seedling establishment, a lettuce crop may get a colder, blue-rich spectrum; during the final biomass accumulation phase, this spectrum may change to a warmer, red-rich spectrum. All of them are contained within the same fixture and what the human eye perceives as "white light."
Applying today's tools correctly-learning to interpret the spectrum graph, posing pertinent questions, and confirming performance through small-scale testing-remains the top goal for the time being.
In conclusion
Finding the whitest light or the cheapest price per watt is not the key to selecting a white LED. It involves aligning crop objectives with spectral composition.
Your three-step evaluation procedure starts with requesting the spectrum graph and examining the blue-to-green balance and R:FR ratio. Second, compare CRI to your operational requirement for visual inspection. Third, verify real-world performance under your settings by conducting a basic plant test.
Begin with a single crop, a single fixture, and a single modest experiment. Create your own data on spectral response. The farmers who get the most out of their lighting investment are the ones who view spectrum as an active choice rather than a spec sheet checkbox.
Are You Prepared to Compare White LED Choices? Discover our spectrum-optimized fixtures or speak with an expert who can assist you in understanding the specifications provided by any vendor.
FAQ
Q: 1.Which white LED spectrum is ideal for plant growth?
A: There isn't just one ideal spectrum. Your crop, growth stage, and operating objectives will determine the best option. The application-specific decision structure can be found in Section 3.
Q: 2.For grow lights, what does CRI mean?
A: The colour rendering accuracy of a light source in comparison to natural sunshine is measured by CRI. High CRI helps growers identify diseases early, diagnose fertiliser deficiencies accurately, and lessen eye strain on their employees. For study or propagation, aim for CRI ≥ 80 and ≥ 90.
Q: 3.What distinguishes cool white from warm white for plants?
A: More red light is typically present in warm white (2700–3500K), which promotes leaf development and flowering. More blue light is present in cool white (5500–6500K), which encourages compact growth. However, because to underlying spectral variances, two 4000K fixtures may yield different findings, making CCT by itself an imperfect guide. Refer to Section 2.1.
Q: 4.How can I interpret a spectrum chart for LEDs?
A: Pay attention to five characteristics: the red peak shape (wide plateau vs. narrow spike), the blue peak (height denotes compactness potential), the green content (affects canopy penetration), the far-red tail (indicates stretch risk and R:FR ratio), and the UV presence below 400 nm. For the whole guide, see Section 2.3.
Q: 5.Why do some white LEDs have distinct effects despite having the same appearance?
A: Metamerism can deceive the human eye by making many spectral combinations appear to be the same white. Plants do not perceive colour; instead, they detect particular wavelengths and ratios. This is the central finding of Valoya's study. Refer to Section 1.1.
Q: 6.What is the R:FR ratio, and why is it important for white LEDs?
A: Plant height and leaf expansion are regulated by the red to far-red ratio. Plants with a high R:FR (>2:1) remain compact. Stretch is triggered by low R:FR (<1.5:1). One of the main reasons two fixtures with the same CCT might yield distinct plant morphology is this ratio, which is concealed inside any white LED spectrum. Refer to Section 1.2.