
How LED Stadium Light Saves Energy Costs
Abstract: Energy consumption constitutes a major operational expenditure for sports facilities. Transitioning to LED-based stadium lighting systems presents a direct method for reducing this financial burden. This analysis details the mechanisms through which LED technology achieves energy savings, supported by operational data and comparative financial models. The discussion encompasses the fundamental efficiency advantages, the role of intelligent controls, long-term performance consistency, and a framework for calculating return on investment for facility managers.
1. Core Mechanisms of Energy Reduction in LED Stadium Lighting
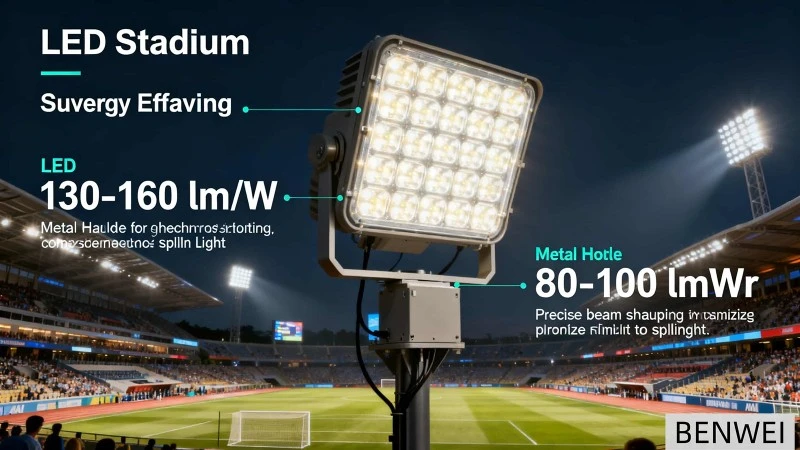
The primary energy savings from LED stadium lights derive from superior luminous efficacy and precise optical control. Luminous efficacy measures light output (lumens) per unit of electrical power input (watts). Modern LED fixtures for stadium applications typically achieve 130-150 lumens per watt. In contrast, traditional metal halide lamps used in sports lighting operate in the range of 80-100 lumens per watt. This fundamental difference means an LED system requires fewer watts to produce the same or greater illuminance on the playing surface.
A secondary saving mechanism is the elimination of wasted light. LED fixtures allow for advanced optics with precise beam shaping (e.g., Type IV or Type V distributions). This ensures a higher percentage of generated lumens are delivered onto the target field, minimizing spill light into non-essential areas. Traditional broad-beam floodlights often illuminate significant areas beyond the field boundaries, consuming power without functional benefit.
2. Quantifying Energy Savings: A Comparative Analysis
The magnitude of energy cost savings is variable, dependent on facility usage patterns, local electricity rates, and the specifications of the legacy system. The following table provides a representative comparison based on a mid-sized collegiate football stadium.
Table 1: Annual Energy Consumption Comparison - Metal Halide vs. LED System
|
Parameter |
Metal Halide System (2000W Fixtures) |
LED System (1200W Fixtures) |
Notes |
|---|---|---|---|
|
Total Connected Power (kW) |
320 kW |
192 kW |
Assumes 160 fixtures. LED maintains equivalent illuminance at 40% lower connected load. |
|
Estimated Annual Hours of Use |
1,200 hours |
1,200 hours |
Includes games, practices, and events. |
|
Annual Energy Consumption (kWh) |
384,000 kWh |
230,400 kWh |
Calculated as (Power kW) * (Hours). |
|
Energy Cost (at $0.12/kWh) |
$46,080 |
$27,648 |
Demonstrates direct cost saving. |
|
Annual Energy Cost Saving |
- |
$18,432 |
A 40% reduction in lighting energy expenditure. |
This simplified model excludes additional savings from reduced demand charges, which are fees based on peak power draw. LED systems, with their lower instantaneous power requirement, directly lower this peak, resulting in further utility bill reductions.
3. The Impact of Lighting Controls and Adaptive Systems
LED technology is inherently compatible with digital control systems, unlocking further energy-saving strategies not feasible with metal halide lamps. These controls transform lighting from a static utility into a dynamic asset.
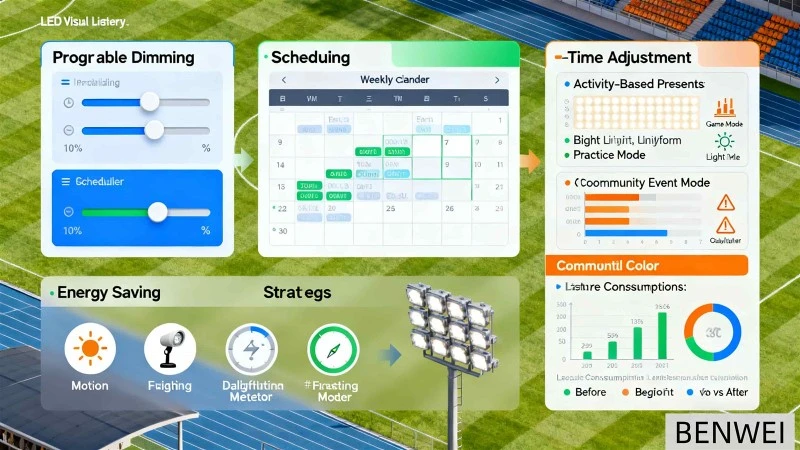
Programmable dimming allows operators to set different illumination levels for various activities. Training sessions may require only 50-75% of full game-level lux. Community events might need even less. This granular control avoids the binary on/off state of older systems, creating significant cumulative savings. Furthermore, scheduling ensures lights are not accidentally left on outside operational hours.
Some advanced systems integrate with broadcast equipment or use photocells to make real-time adjustments. Lights can be dimmed during daytime events with sufficient natural light or focused specifically on areas in use for non-sporting events, preventing energy waste across the entire field.
4. Long-Term Performance and Maintenance Cost Synergies
The energy-saving advantage of an LED system is not static; it is preserved over time due to superior lumen maintenance. All light sources experience lumen depreciation, a gradual decline in light output. High-quality LED fixtures are rated to maintain over 90% of their initial output (L90) for 50,000 hours or more. The correlated color temperature (CCT) also remains stable.
Metal halide lamps suffer from rapid depreciation, often losing 30-40% of their initial output within the first 40% of their shorter lifespan (typically 5,000-15,000 hours). To compensate and maintain required lighting standards, facilities often over-light initially or replace lamps prematurely, both of which inflate effective energy use. The stable output of LEDs ensures the designed energy-efficient performance level is sustained for years, with no hidden energy cost creep.
Reduced maintenance frequency directly lowers energy-related operational costs. Fewer lamp replacements mean less fuel consumption for service vehicle trips and lower labor hours spent on relamping, which itself consumes organizational energy.
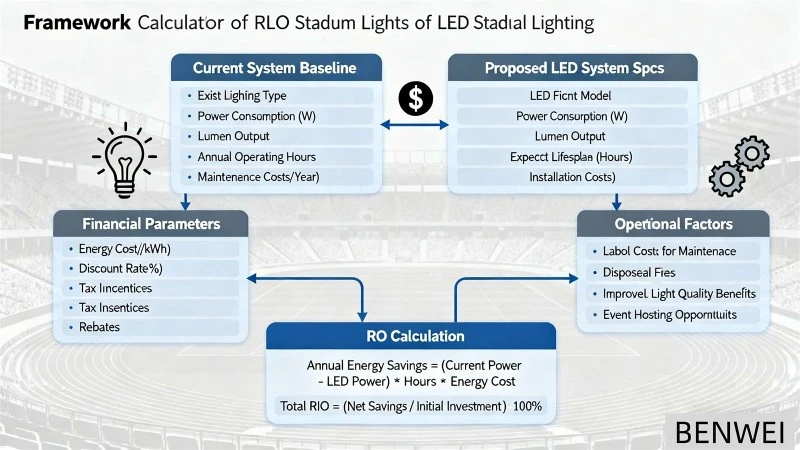
5. Calculating Project-Specific Savings and Return on Investment
Facility managers must evaluate savings based on their specific parameters. The following framework outlines the necessary data and calculations.
Table 2: Inputs for a Customized LED Energy Savings Analysis
|
Data Input Category |
Specific Parameters Required |
Source |
|---|---|---|
|
Current System Baseline |
Fixture type, quantity, individual wattage, ballast loss factor (if applicable), annual operating hours. |
Facility maintenance records, utility bills. |
|
Proposed LED System |
Total connected load (kW), projected illuminance levels (lux/footcandles). |
Manufacturer specifications, photometric study. |
|
Financial Parameters |
Local electricity rate ($/kWh), utility demand charge structure, projected annual energy cost escalation rate. |
Utility bills, utility company. |
|
Operational Factors |
Planned control strategies (dimming schedules, zoning). |
Facility event calendar. |
The analysis should project annual kWh savings, annual cost savings, and the simple payback period. A comprehensive life-cycle cost analysis (LCCA) will also factor in avoided maintenance costs and the longer lifespan of LED fixtures, presenting a more complete financial picture than energy savings alone.

6. Addressing Common Implementation Challenges
Perceived High Initial Cost. The upfront investment for an LED system exceeds that of a like-for-like metal halide replacement. Solution: The financial evaluation must be based on Total Cost of Ownership (TCO). Financing options, utility rebates, and Energy Performance Contracts (EPCs) can mitigate initial capital outlay. The return on investment is driven by the sustained energy and maintenance savings detailed in sections 2 and 4.
Ensuring Technical Performance and Compliance. Concerns exist about whether LED can meet strict vertical illuminance and uniformity standards for high-definition television (HDTV) broadcast. Solution: A photometric analysis conducted by a qualified lighting designer is non-negotiable. This computer simulation uses fixture-specific IES files to model light distribution, proving compliance with standards like IES RP-6 or EN 12193 before installation.
Glossary of Terms
Luminous Efficacy: The ratio of luminous flux (lumens) emitted to the power (watts) consumed by the light source. Unit: lm/W.
Lumen Maintenance (Lx): A measure of how well a light source maintains its light output over time. L90 > 50,000 hours means the fixture will not fall below 90% of its initial lumens for at least 50,000 hours.
Demand Charge: A fee charged by electric utilities based on the highest rate of electricity consumption (peak demand, measured in kW) during a billing period.
Photometric Study: A computer-based lighting simulation that predicts illuminance levels, uniformity, and glare metrics for a given fixture layout and aiming.
Correlated Color Temperature (CCT): A specification of the color appearance of light emitted by a source, measured in Kelvins (K). Stadium lighting typically uses 4000K-5700K.
References and Further Reading
Illuminating Engineering Society (IES). *RP-6-20: Sports and Recreational Area Lighting*. New York: IES, 2020. https://www.ies.org/standards/
U.S. Department of Energy. Energy Savings Forecast of Solid-State Lighting in General Illumination Applications. January 2022. https://www.energy.gov/eere/ssl/ssl-forecast-reports
National Lighting Bureau (NLB). Life Cycle Cost Analysis for Lighting Systems. https://www.nlb.org/
DesignLights Consortium (DLC). Qualified Products List (QPL) for Networked Lighting Controls. https://www.designlights.org/qpl
https://www.benweilight.com/lighting-tube-bulb/78000lm-led-stadium-light-outdoor-400w-flood.html